The global appeal of sport has necessitated the rapid adoption of digital viewership, be it via traditional TV or streaming platforms.
When live sports initially hit TV screens in the late 20th century, it was mostly viewed as a viable alternative for spectators unable to be physically present at the stadium. Followers across the globe were accustomed to tuning into the radio to catch live updates – live TV changed that forever, driving radio into near extinction.
Prior to the ‘smartphone boom’ in the early 2010s, sports broadcasters depicted important information using numbers and shape overlays. Arguably, no graphic element has had a bigger impact than the ‘1st and Ten’ Yellow Line in American Football during the mid-1990s.

A personal example: The author did not understand the workings of American Football other than the concept of touchdowns and points awarded for that action. While casually watching the highlights of an NFL (National Football League) game, the ‘1st & Ten’ yellow line helped the author to visualise the distance to be covered by the team in possession of the ball, in order to progress towards the next phase of the game. This graphic overlay looks simple enough today, while it cost broadcasters like Fox Sports and ESPN close to $25,000 per game back in the 1990s.
The ‘1st and Ten’ yellow line proved to broadcasters that there is value and viewership to unlock through sports broadcast graphics. The wider availability of a screen, fuelled by the aforementioned ‘smartphone boom’ has created increased demand for a quality viewership experience. Sports broadcasters today often rely on 3rd party organisations, such as DixonBaxi, MST Systems and LIGR Systems, to name a few, for innovations in 2 key areas: design and data-driven insights.
Striking a balance between both areas is a big challenge for sports broadcasters. Maintaining this balance is further complicated by the push from rightsholders to attract new audiences, in addition to keeping existing viewers engaged. Broadcast revenue constitutes a significant portion of income for sports rightsholders and teams across the world.
Design
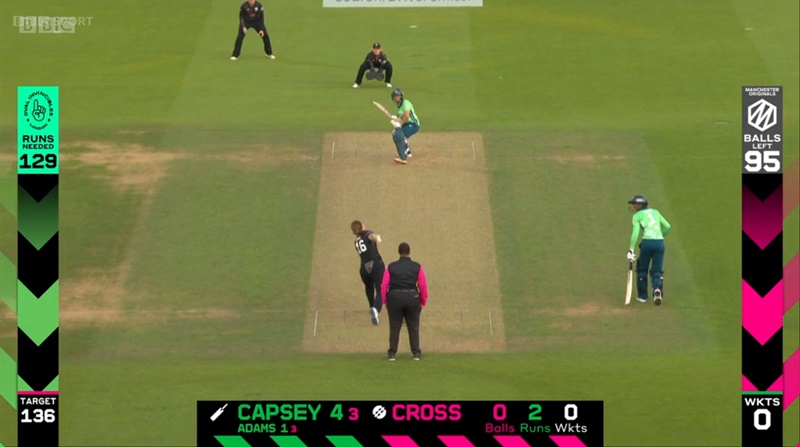
The visuals that form ‘the product’ are influenced by the objectives set out by the sports rightholder. For example, The Hundred (a 100-ball cricket tournament held in England) wanted to project a simpler-yet-‘modern’ outlook of the sport. Jump Design was commissioned to create impactful graphics similar to a video game.
The design language used during the broadcast is carried forward into the highlights package, official audiovisual content, social media posts and media communications.
Data-Driven Insights
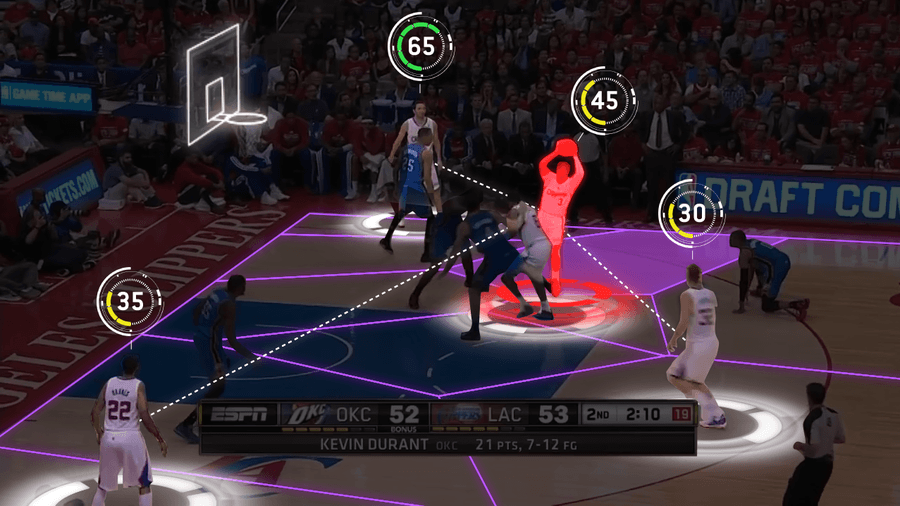
In almost every case, a graphics solution is only as good as the data that it is designed to communicate. Whether that data is live sports data, advanced KPIs (Key Performance Indictors), or non-critical information, the broadcast package presents viewers with visually impactful information. The visualisation of data requires sophisticated software which is traditionally developed by a 3rd party in partnership with the rightsholders or broadcaster.

Features are specifically designed for each sports environment – tennis requires a different set of data visualisations compared to golf. A sport that required to radically change its broadcast package is Formula 1. Until 2017, Formula 1’s broadcast graphics portrayed KPIs such as live timing and driver position – no additional information was relayed. However, the new promoters of the racing category, Liberty Media, introduced a revamped broadcast package that has subsequently made it far easier for new viewers to understand the live events of a race.

Broadcast graphics have come a long way since the ‘1st and Ten’ yellow line transformed the way sport was viewed in the 1990s. Big data companies like Amazon Web Services, Cognizant, Microsoft and Oracle have invested significantly in a bid to show off various AI (Artificial Intelligence) and ML (Machine Learning) solutions and their applicability in sport.
Is too much data too bad?
Let us know in the comments!
#Vilayinsights